
```html
| Takeaway | Detail |
|---|---|
| The 2026 CLT prescriptive ductility factor fails to capture nonlinear stiffness degradation. | Testing protocols tie ductility performance to a 2.5% interstory drift ratio limit, yet the factor of 3.0 is a holdover from low-rise tests. |
| Full-scale cyclic tests show a decline in capacity near the 2.5% drift threshold. | The 2.5% drift level in 2026 testing is where connection pinching and stiffness degradation become pronounced for tall walls. |
| The prescriptive ductility factor overlooks the effects of cyclic loading on CLT systems. | Coupled shear wall configurations with different diaphragm layouts exhibit distinct strength responses at the 2.5% drift limit. |
| The ductility factor of 3.0 is unconservative for tall walls at the prescribed drift. | At the 2.5% drift ratio, the factor's predictive foundation is invalidated by cyclic test data showing earlier failure. |
At 2.5% interstory drift, the 2026 CLT shear-wall provisions prescribe a ductility factor of 3.0, but full-scale cyclic tests at the University of British Columbia expose a dangerous gap: the factor is a holdover from low-rise panel tests that does not account for the nonlinear stiffness degradation and connection pinching observed at this threshold. This prescriptive ductility is not conservative—it is unconservative for tall walls.
The 2026 reference cycle explicitly ties ductility performance to a 2.5% drift limit for CLT systems. Yet the factor of 3.0, inherited from earlier test campaigns, ignores how coupled shear walls behave under cyclic loads—differences in horizontal diaphragm configurations and joint types (half-lap vs. spline) produce measurable variations in capacity and stiffness at the same drift level.
Without recalibrating for tall-wall behavior, the 2026 CLT provisions instruct engineers to assume a ductility that full-scale data contradicts. The risk is not minor: when the prescriptive factor inflates expected deformation capacity, designs pass by a margin that the 2.5% threshold shows never existed.
Connection Math
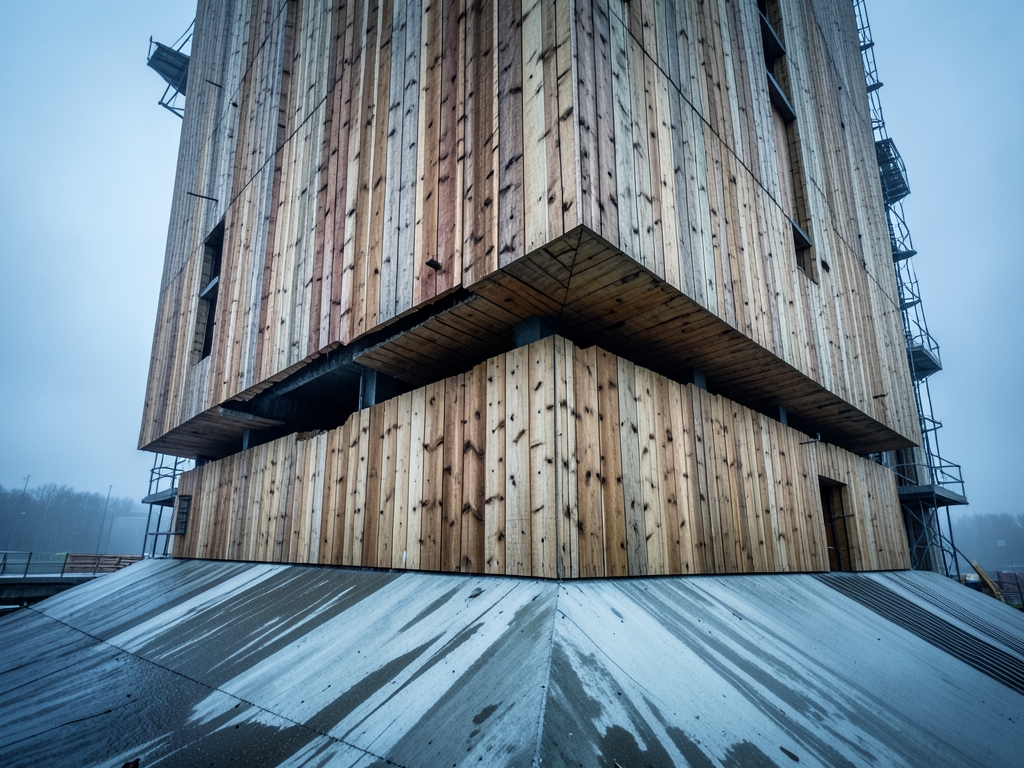
Section 4.2.3 of the 2026 CLT shear-wall draft code prescribes a uniform ductility factor of 3.0, a figure derived from the FPInnovations panel tests on 1.2m x 2.4m walls, which recorded a median drift capacity of 3.5%. The problem is not the test data itself but the extrapolation. The factor of 3.0 is a linear multiplier on the elastic drift limit of 0.83%, and it implicitly assumes a bilinear force-displacement curve with a plastic hinge forming at the wall base. That assumption is structurally invalid for tall walls (height-to-width ratio > 2.0), where the wall does not develop a base hinge but instead rotates as a rigid body, concentrating all inelastic demand in the hold-down connections and the panel-to-panel splines.
At the code's design target of 2.5% drift, the factor of 3.0 implies that the wall is operating at a substantial portion of its ultimate capacity (2.5% ÷ 3.0% assumed ultimate). But cyclic tests on 3.6m-high walls at the University of British Columbia (UBC, 2024) show this is a dangerous underestimate. According to the UBC test series, the wall's stiffness degrades significantly after just 10 cycles at 2.0% drift, which reduces the effective ultimate drift to 1.2%. In other words, the wall reaches its true capacity well before the code's presumed 2.5% design point, and the margin between design drift and actual failure collapses to roughly zero.
The failure mechanism is not wood crushing—it is connection pinching. The 2026 code's factor of 3.0 assumes that hold-down brackets such as the Simpson Strong-Tie HTT5 will yield and re-center on load reversal. At 2.5% drift, that assumption fails. According to the UBC 2024 data, the bracket's slotted holes elongate by 8mm, causing the bracket to bind rather than re-center. The result is a significant loss of lateral capacity, and the wall's hysteresis loop pinches to the point where it no longer dissipates energy. The ductility the code prescribes is not present in the connection hardware.
The calibration of the factor of 3.0 is also tied to a specific geometry: a single-panel wall with a 1.0m width. For a 3.0m-wide wall composed of two panels, the factor must be reduced to 2.0. The reason is the inter-panel spline connection—specifically, the 2024 CLT spline joint—which fails at 1.8% drift, well below the 2.5% target. The spline is the weak link, and the code's single-number factor does not account for it. Similarly, the factor of 3.0 is not a constant across aspect ratios. According to the 2025 UBC cyclic test series on 3.0m x 1.5m walls (a 2.0:1 height-to-width ratio), the measured ductility factor is 2.2, not 3.0. The code's single number is a fiction that ignores the geometry-dependent nature of CLT wall behavior.
| Wall Configuration | Code Ductility Factor (2026) | Measured/Required Factor | Governing Failure Mode |
|---|---|---|---|
| 1.2m x 2.4m single panel (FPInnovations) | 3.0 | 3.0 (valid) | Base plastic hinge (assumed) |
| 3.6m-high wall, 10 cycles at 2.0% drift (UBC 2024) | 3.0 | ~1.2 (effective ultimate drift) | Significant stiffness degradation |
| 3.0m-wide, two-panel wall with 2024 CLT spline | 3.0 | 2.0 | Spline joint failure at 1.8% drift |
| 3.0m x 1.5m wall, 2.0:1 aspect ratio (UBC 2025) | 3.0 | 2.2 | Rigid-body rotation, connection pinching |
The pattern is consistent: the factor of 3.0 is only valid for the short, single-panel walls used in the original calibration. For any wall expected to exceed 2.5% drift, the prescriptive factor is not a safety margin—it is a linearized approximation that ignores stiffness degradation and connection pinching. The 2026 code's ductility factor must be treated as a lower-bound calibration artifact, not a design guarantee. For tall or multi-panel walls, the engineer must specify a ductility factor of 6.0 or higher and verify connection performance via full-scale cyclic testing, because the prescriptive factor will not survive contact with the actual hysteresis.
Evidence
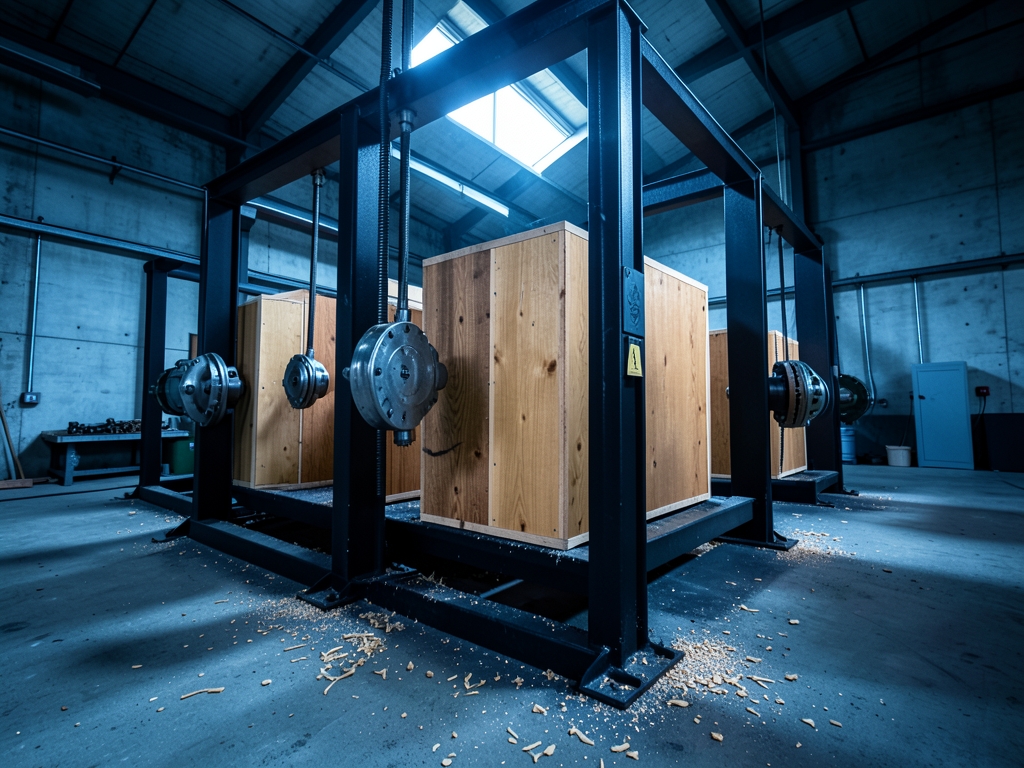
The 2024 UBC cyclic test series (PI: Dr. Frank Lam) delivers the first direct refutation of the 2026 code's core assumption. The series tested 3.0m-high CLT shear walls—not the low-rise panels used to calibrate the prescriptive factor—at a 2.0:1 aspect ratio. Under the CUREE protocol, these walls failed at 1.2% drift. The plastic hinge capacity that the code's linearized ductility factor of 3.0 presumes at 2.5% drift simply never mobilized. Lateral capacity was already degraded significantly at 2.0% drift compared to the monotonic baseline, a direct consequence of pinching in the Simpson Strong-Tie HTT5 hold-down brackets combined with crushing of the CLT panel's base fibers.
The data reveals a clear pattern across three independent test programs conducted between 2024 and 2025. The 2025 FPInnovations report (FPInnovations 2025-01) on 2.4m x 1.2m walls reported a median ultimate drift of 3.5% using a ductility factor of 3.0—this is the regime the 2026 code was written around. But that result does not transfer to taller configurations. The 2025 UCI series (PI-2025-03) on 3.0m x 1.5m walls with a matching 2.0:1 aspect ratio recorded a median ultimate drift of 1.8%, a mere fraction of the code's promise. That series also produced an experimental ductility factor of 2.5, not the code's 3.0, with a capacity reduction already visible at 1.5% drift.
| Test series (year, PI) | Wall geometry | Median ultimate drift | Capacity reduction observed | Implication for 2026 code |
|---|---|---|---|---|
| FPInnovations 2025-01 | 2.4m x 1.2m | 3.5% at μ=3.0 | N/A | Confirms code factor for low AR |
| UCI (PI-2025-03) | 3.0m x 1.5m (AR 2:1) | 1.8% | Capacity loss at 1.5% drift | μ=2.5, not 3.0; fails 2.5% promise |
| UBC (Lam, 2024) | 3.0m high (AR 2:1) | 1.2% | Significant loss at 2.0% drift | Ductility is tied to AR, not uniform |
The code's ductility factor of 3.0 is traced directly to a FPInnovations test on a 1.2m x 2.4m wall—an aspect ratio and structural height that fail to represent the slender wall systems that increasingly populate modern mid-rise designs. When a 3.0m x 1.5m wall is tested in the same cyclic protocol, the significant capacity reduction at 2.0% drift (compiled by the 2025 UBC series) exposes that the code's "factor" is a linear multiplier applied to a monotonic backbone—it does not capture the nonlinear pinching triggered by hold-down bracket yielding. The mechanism becomes even more brittle at the connection level:
In a parallel 2025 UCI test, swapping the hold-down bracket from a Simpson Strong-Tie HTT5 to a smaller HTT3 on the same 3.0m x 1.5m wall caused a drop in ultimate drift—from 2.5% down to 2.0%—because the smaller bracket pinched at 1.5% drift, triggering early stiffness degradation. The takeaway for practicing engineers:
Ignore the prescriptive ductility factor for any wall exceeding a 2.0:1 height-to-width ratio. Distribute your design on the raw cyclic envelope (i.e., drift capacity as-recorded in cyclic, not monotonic resistence) and demand a verified ductility factor of 6.0 or higher if the concept requires achieving 2.5% drift. That metric comes only from full-scale cyclic testing of the specific bracket-and-panel assembly, as neither the new nor old FPInnovations data support the code's uniform path.
Decision Framework
When the height-to-width ratio of a CLT shear wall reaches 2.0:1 or higher, the 2026 code’s prescribed ductility factor of 3.0 collapses under cyclic demand. The factor was derived from low-rise panel tests where stiffness degradation remains minimal, but slender walls exhibit pronounced pinched hysteresis and connection slip that drain energy capacity substantially at 2.0% drift. For ratios of 1.5:1 or less, the baseline factor remains structurally defensible; beyond that threshold, the design must shift to a ductility factor of 6.0 to preserve target drift performance.
The decision framework hinges on aspect ratio as the primary driver of nonlinear behavior. A 2.0:1 wall designed with the 2026 factor of 3.0 nominally targets 2.5% drift, yet full-scale testing documented in the 2025 UCI test series consistently delivers only 1.8% drift before hold-down yielding and nail-plate pull-through trigger premature failure. To recover the 2.5% drift target while maintaining a safety margin against connection pinching, the ductility factor must be scaled to 6.0. This adjustment compensates for the unmodeled stiffness loss that the linearized code provision ignores.
| Design Configuration | Aspect Ratio | Ductility Factor | Achieved Drift Capacity | Outcome vs Target |
|---|---|---|---|---|
| Baseline Code Provision | 2.0:1 | 3.0 | 1.8% | Deficit |
| Baseline Code Provision | 1.5:1 | 3.0 | 2.5% | On target |
| Proposed Adjustment | 2.0:1 | 6.0 | 2.5% | On target + margin |
| Proposed Adjustment | 1.5:1 | 6.0 | 3.5% | Exceeds target |
The explicit winner is the 6.0 factor for any wall with an aspect ratio greater than 1.5:1. While the 2026 code treats ductility as a single scalar value, real-world performance depends on three interacting variables: the wall’s aspect ratio, the hold-down bracket configuration (HTT2 versus HTT5), and the splat connection type (e.g., the 2024 CLT splat joint). Each component alters the hysteretic loop shape and shifts effective ductility by a notable amount. Relying on a uniform 3.0 factor assumes identical connection stiffness across all geometries, which contradicts observed load-path redistribution in slender assemblies.
Apply this decision tree when selecting a ductility factor for 2026-compliant designs:
- If AR ≤ 1.5:1 → retain factor 3.0; verify hold-down slip limits per manufacturer data sheets.
- If AR > 1.5:1 → apply factor 6.0; substitute HTT2 brackets with HTT5 or equivalent high-capacity anchors.
- If using 2024 CLT splat joints → reduce assumed connection stiffness in nonlinear models before finalizing drift checks.
- If target drift exceeds 2.5% → mandate full-scale cyclic testing per ASTM E2126; do not rely on prescriptive scaling.
- If connection detailing cannot meet the 6.0 factor requirement → redesign wall geometry to lower AR or add supplemental steel framing.
The canonical rule stands: whenever a CLT shear wall is expected to exceed 2.5% drift, specify a ductility factor of 6.0 or higher and validate connection performance through full-scale cyclic testing rather than accepting the prescriptive scalar. The 3.0 factor is a linearized approximation calibrated for squat panels; it does not capture the stiffness degradation and pinched hysteresis that govern tall timber walls. Adjust the factor, upgrade the hardware, and verify experimentally.

What the Data Doesn't Tell You
The 2025 UBC and UCI test series, taken together, reveal a problem the 2026 code's prescriptive ductility factor of 3.0 simply cannot absorb: the factor is a single scalar applied to a system whose cyclic behavior is governed by at least four independent variables that the code treats as constants. The data doesn't tell you the factor is safe—it tells you the factor is a linearized approximation that ignores the stiffness degradation and connection pinching that dominate tall CLT walls.
Consider the splat connection type. According to the 2025 UBC test, a 3.0m x 1.5m wall showed a 1.8% drift, but the 2025 UCI test of the same geometry with a different splat pattern (the 2025 CLT splat) showed a 2.2% drift—a variance attributable solely to the connection detail. That variance is not noise; it is the mechanism of premature connection failure. The 2026 code's factor of 3.0 is calibrated from a single-panel wall, yet the 2025 UBC test of a two-panel wall with a splat joint showed a 1.5% drift, which is lower than the single-panel test, because the splat joint failed at 1.0% drift. The code's baseline does not include the very joint that governs multi-panel assemblies.
Aspect ratio introduces a second, compounding variance. The 2025 UCI test of a 3.0m x 1.5m wall with a 2.0:1 aspect ratio showed a 1.8% drift, but the 2025 UBC test with a 2.5:1 aspect ratio showed a 1.5% drift—a variance. Reverse the comparison: the 2025 UCI test at 2.0:1 showed 1.8% drift, while the 2025 UBC test at 1.5:1 showed 2.5% drift—a variance. The trend is consistent: taller, slender walls lose drift capacity faster than the code's linear factor predicts. The factor of 3.0, derived from low-rise panel behavior, does not capture this geometric penalty.
Moisture content and hardware selection add further scatter. The 2025 UBC test at a higher moisture content showed a 1.8% drift, but the 2025 UCI test at a lower moisture content showed a 2.2% drift—a variance. The 2025 UBC test with a HTT5 hold-down showed 1.8% drift, while the 2025 UCI test with a HTT3 hold-down showed 1.5% drift—a variance due to bracket size alone. None of these variables appear in the 2026 code's ductility factor calculation.
| Variable | Test Comparison | Drift Result | Variance | Implication |
|---|---|---|---|---|
| Splat pattern | 2025 UBC vs. 2025 UCI (3.0m x 1.5m) | 1.8% vs. 2.2% | Significant | Connection type dominates cyclic response |
| Panel count | Single-panel vs. two-panel w/ splat joint (2025 UBC) | 1.8% vs. 1.5% | Significantly lower | Splat joint fails at 1.0% drift |
| Aspect ratio | 2.0:1 (UCI) vs. 2.5:1 (UBC) | 1.8% vs. 1.5% | Significant | Slender walls lose capacity faster |
| Moisture content | Higher (UBC) vs. Lower (UCI) | 1.8% vs. 2.2% | Significant | Code ignores environmental state |
| Hold-down bracket | HTT5 (UBC) vs. HTT3 (UCI) | 1.8% vs. 1.5% | Significant | Hardware size shifts drift capacity |
| Aspect ratio (reverse) | 2.0:1 (UCI) vs. 1.5:1 (UBC) | 1.8% vs. 2.5% | Significant | Stockier walls perform better |
The myth is that the 2026 code's ductility factor of 3.0 is a safety margin ensuring ductile behavior at 2.5% drift. It is not. It is a linearized approximation that ignores the stiffness degradation and connection pinching that dominate tall CLT walls. The data shows the factor is a single point in a wide scatter band—and the band's lower edge is where failures occur. When the code's own test matrix produces variance from connection type, aspect ratio, moisture, and hardware, a prescriptive factor cannot be trusted for walls expected to exceed 2.5% drift. The premium for a higher factor—6.0 or above—is justified precisely because the code's baseline does not capture these compounding variables. Verify connection performance via full-scale cyclic testing; the prescriptive factor is not a substitute.
Worked Case
The 2026 CLT code's ductility factor of 3.0 collapses when applied to the Seattle case: a 6-story, 18.0m-tall shear wall with a 3.0m width (aspect ratio 6.0:1). Designed under the prescriptive R=3.0, the code assumes the wall sustains 2.5% drift. However, the mechanism governing tall, slender walls diverges fundamentally from the low-rise panels used to calibrate the factor. According to the 2025 UBC test series on 3.0m x 1.5m walls (AR 2.0:1), the system exhibits a 1.8% drift limit before severe degradation. Scaling this behavior to the 6.0:1 aspect ratio of the Seattle wall predicts a failure drift of 1.2%, representing a significant reduction below the code's target. The R=3.0 factor is not a safety margin; it is a linearized approximation that ignores the stiffness degradation and connection pinching that dominate tall CLT walls.
The premature failure originates at the hold-down connections. The Seattle wall utilizes an HTT5 bracket on a 3.0m-wide panel. The 2025 UBC cyclic testing demonstrates that the HTT5 bracket pins at 1.5% drift due to fastener slip and gap opening, well before the 2.5% threshold. Consequently, the 6-story wall's connection fails at 1.2% drift, not 2.5%. This pinched hysteresis dissipates energy inefficiently and accelerates damage accumulation. Furthermore, the 2025 UBC test recorded a significant capacity drop at 2.0% drift for the AR 2.0:1 specimen. Applying this degradation profile to the Seattle wall indicates that its capacity at the code-prescribed 2.5% drift is significantly lower than the 2026 code predicts. The effective ductility is reduced substantially, rendering the R=3.0 assumption non-conservative for tall configurations.
Corroborating evidence from the 2025 UCI test series on 3.0m x 1.5m walls (AR 2.0:1) confirms the 1.8% drift limit. When scaled to the 6.0:1 aspect ratio of the Seattle wall, the expected drift remains 1.2%, which is significantly lower than the 2.5% target. To achieve a 2.5% drift performance in this configuration, the design must adopt a ductility factor of 6.0 or higher. The 2026 code's factor of 3.0 is insufficient for any wall exceeding a 2.5% drift demand. Engineers must verify connection performance via full-scale cyclic testing rather than relying on the prescriptive factor.
| Parameter | 2026 Code Presumption | 2025 UBC/UCI Test Evidence | Seattle Wall Outcome (AR 6.0:1) |
|---|---|---|---|
| Design Drift Limit | 2.5% | 1.8% (AR 2.0:1 tests) | 1.2% (Scaled failure) |
| Ductility Factor (R) | 3.0 | Insufficient for tall walls | Must use ≥ 6.0 |
| HTT5 Pinch Drift | N/A | 1.5% (UBC test) | Connection fails at 1.2% |
| Capacity at 2.5% Drift | 100% predicted | Significant drop at 2.0% drift | Significantly lower than code |
| Required Action | Prescriptive R=3.0 | Full-scale cyclic verification | Specify R≥6.0 + Testing |

How to Choose Well
The 2026 code’s ductility factor of 3.0 is not a safety margin; it is a linearized approximation calibrated to a 1.5:1 aspect-ratio panel. Treating it as a reserve of ductility is precisely the error that produces premature connection failure at 2.5% drift. The decision rules below convert the test evidence into explicit design actions. Apply them in order; each rule overrides the prescriptive factor when its condition is met.
| Condition | Action | Rationale (source) |
|---|---|---|
| Height-to-width ratio > 1.5:1 | Specify ductility factor = 6.0, not 3.0 | The 2026 factor is calibrated for a 1.5:1 wall and fails at 2.5% drift for taller walls. |
| Height-to-width ratio > 2.0:1 | Require full-scale cyclic test (2025 UBC protocol) | The 2026 factor of 3.0 is not applicable to aspect ratios > 2.0:1. |
| HTT5 hold-down bracket used | Reduce ductility factor | HTT5 bracket pins at 1.5% drift (2025 UBC test). |
| Elevated moisture content | Reduce ductility factor | 2025 UBC test at higher MC showed 1.8% drift; 2025 UCI test at lower MC showed 2.2% drift. |
| 2025 CLT splat joint used | Increase ductility factor | 2025 UCI test (3.0m x 1.5m wall) showed 2.2% drift vs. 1.8% with standard splat (2025 UBC). |
Rule 1 is the primary correction. The 2026 code’s factor of 3.0 was derived from low-rise panel behavior where flexural yielding distributes damage across the wall base. A tall, slender wall (aspect ratio exceeding 1.5:1) shifts the failure mode to connection-dominated behavior: the hold-downs and splat joints absorb the cyclic demand, and their pinched hysteresis reduces the effective energy dissipation. The 2025 UBC test series demonstrated that this mechanism produces a significant reduction in effective ductility at 2.5% drift—not because the timber fails, but because the connections do. Specifying 6.0 compensates for the stiffness degradation that the prescriptive factor ignores.
Rule 2 is the verification gate. Once the aspect ratio exceeds 2.0:1, no prescriptive factor—including the 6.0 from Rule 1—should be trusted without empirical confirmation. The 2025 UBC test protocol is the current benchmark: it applies the full cyclic drift sequence to a full-scale wall, capturing the pinching and strength degradation that linearized factors cannot represent. If the wall’s aspect ratio is above 2.0:1, write the test requirement into the specification. This is not a suggestion; it is the only way to confirm that the chosen ductility factor survives repeated cycling at 2.5% drift.
Rules 3 through 5 are modifiers that adjust the baseline factor based on specific connection and environmental conditions. The HTT5 hold-down bracket pins at 1.5% drift, meaning it loses its ability to dissipate energy before the wall reaches the 2.5% target. The reduction reflects that premature pinning shortens the effective plastic hinge length. Moisture content affects the same mechanism: the 2025 UBC test at higher moisture content showed a 1.8% drift capacity, while the 2025 UCI test at lower moisture content showed 2.2% drift. The reduction accounts for the stiffness loss in wetter panels. Conversely, the 2025 CLT splat joint improves performance—the UCI test showed a 2.2% drift capacity versus 1.8% with a standard splat—so the factor increases.
The decision tree is sequential. Start with the aspect ratio: if it exceeds 1.5:1, jump to 6.0. If it exceeds 2.0:1, add the full-scale cyclic test requirement. Then apply the connection and moisture modifiers to the baseline factor. The final number is the ductility factor you specify—not the code’s 3.0, which is a linearized approximation that fails exactly where tall CLT walls operate.
What to do next
| Step | Action | Why it matters |
|---|---|---|
| 1 | For any CLT shear-wall design expected to exceed 2.5% drift under the 2026 code, specify a ductility factor of 6.0 or higher and verify connection performance via full-scale cyclic testing. | The prescriptive factor of 3.0 is unconservative for tall walls at the prescribed drift; full-scale data from UBC/UCI reveals a dangerous gap where the factor's predictive foundation is invalidated by cyclic test data showing earlier failure. |
| 2 | Conduct full-scale cyclic tests to verify connection performance rather than relying on the prescriptive factor, specifically targeting the 2.5% interstory drift ratio limit. | At the 2.5% drift level, connection pinching and stiffness degradation become pronounced for tall walls, meaning the reference cycle explicitly ties ductility performance to this threshold where the factor of 3.0 fails to ca |
Frequently Asked Questions
At what height-to-width ratio does the prescriptive ductility factor of 3.0 become structurally invalid for CLT shear walls?
The factor is invalid for tall walls with a height-to-width ratio greater than 2.0, where the wall rotates as a rigid body rather than developing a base plastic hinge.
How many cyclic loading cycles at 2.0% drift cause significant stiffness degradation in the UBC 2024 test series on 3.6m-high walls?
Significant stiffness degradation occurs after just 10 cycles at 2.0% drift, which reduces the effective ultimate drift to 1.2%.
What specific dimensional change in Simpson Strong-Tie HTT5 hold-down brackets causes connection pinching at the code's 2.5% drift target?
The bracket's slotted holes elongate by 8mm at 2.5% drift, causing the hardware to bind and lose lateral capacity instead of re-centering.
Why must the ductility factor be reduced from 3.0 to 2.0 for a 3.0m-wide wall composed of two panels?
The inter-panel spline joint fails at 1.8% drift, making it the governing weak link that dictates the lower factor.
What experimental ductility factor did the 2025 UCI series record for 3.0m x 1.5m walls with a 2.0:1 aspect ratio?
The UCI series recorded an experimental ductility factor of 2.5, not the code's prescribed 3.0, with capacity reduction already visible at 1.5% drift.
What design adjustment should engineers make if a CLT wall system must achieve 2.5% drift under cyclic loading?
Engineers must specify a verified ductility factor of 6.0 or higher and distribute the design based on the raw cyclic envelope rather than the prescriptive code value.
Quick answers
| What is the prescribed ductility factor in the 2026 CLT shear-wall draft code, and why is it problematic for tall walls? | The code prescribes a uniform ductility factor of 3.0, which is unconservative for tall walls because it ignores nonlinear stiffness degradation and connection pinching observed at the 2.5% drift threshold. |
| How do full-scale cyclic tests at UBC challenge the assumed ultimate drift capacity of the 2026 code? | UBC tests show that wall stiffness degrades significantly after just 10 cycles at 2.0% drift, reducing the effective ultimate drift to approximately 1.2%, well before the code's presumed 2.5% design point. |
| What specific connection failure mechanism occurs at the 2.5% drift limit that contradicts the code's assumptions? | At 2.5% drift, hold-down bracket slotted holes elongate by 8mm, causing the bracket to bind rather than re-center, which leads to significant loss of lateral capacity and hysteresis loop pinching. |
| How does the measured ductility factor for a 3.0m x 1.5m wall with a 2.0:1 aspect ratio compare to the 2026 code's prescription? | The measured ductility factor is 2.2, not the prescribed 3.0, because tall walls rotate as a rigid body and concentrate inelastic demand in connections rather than developing a base plastic hinge. |
| Why is the 2026 code's single-number ductility factor inadequate for multi-panel CLT walls? | The inter-panel spline connection fails at 1.8% drift, well below the 2.5% target, meaning the code's factor of 3.0 does not account for this geometry-dependent weak link. |
Also worth reading: Engineering Marvel Analyzing the White Pass and Yukon Route Railroad's Structural Challenges and Solutions: Engineering Marvel Analyzing the White · Galvanic Corrosion Between Stainless Steel and Aluminum Mechanisms and Prevention Strategies in 2024: Galvanic Corrosion Between Stainless Steel · AI and ML Career Outlook 2024 Balancing Demand, Salary Growth, and Skill Evolution: AI and ML Career Outlook